Dashboards are the homepage of Leadtime. They serve as a personalized overview where users can see all the information, tasks, and tools relevant to them right when they open the app.
Everyone can create their own dashboards, customize them, and design them to best fit their daily workflows.
Dashboards in Leadtime are a flexible tool to bundle information, tools, and reports all in one place.
Each user can create their own workspace — from quick time tracking to complex reporting views.
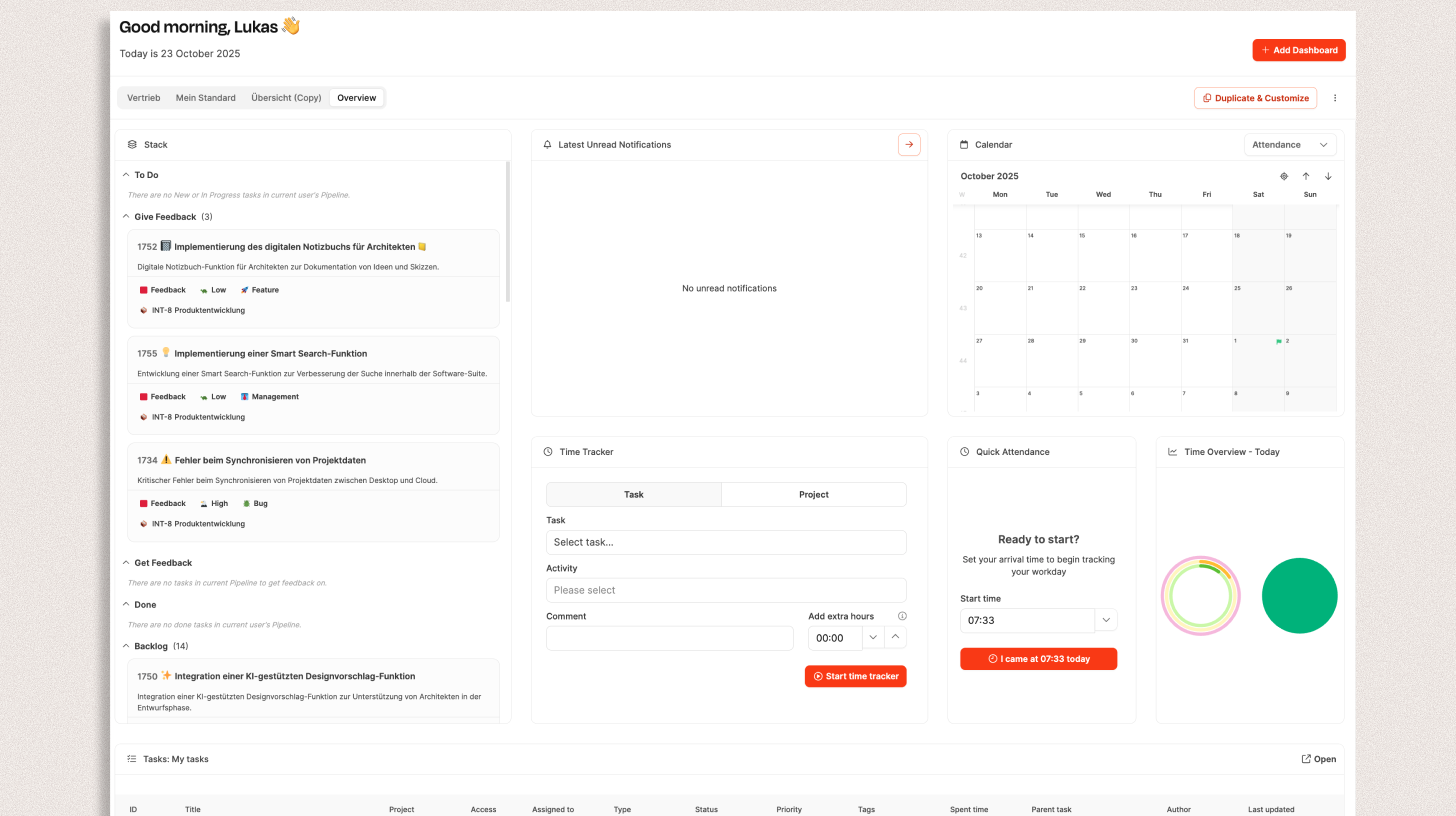
The first time you open Leadtime, it shows a standard dashboard called Overview (Übersicht).
This includes a set of preconfigured widgets that provide core info and tools — like task lists, calendars, time stats, or notifications.
On top, users can create as many custom dashboards as they want and tweak them to their liking.
At the top right, click “Add Dashboard”.
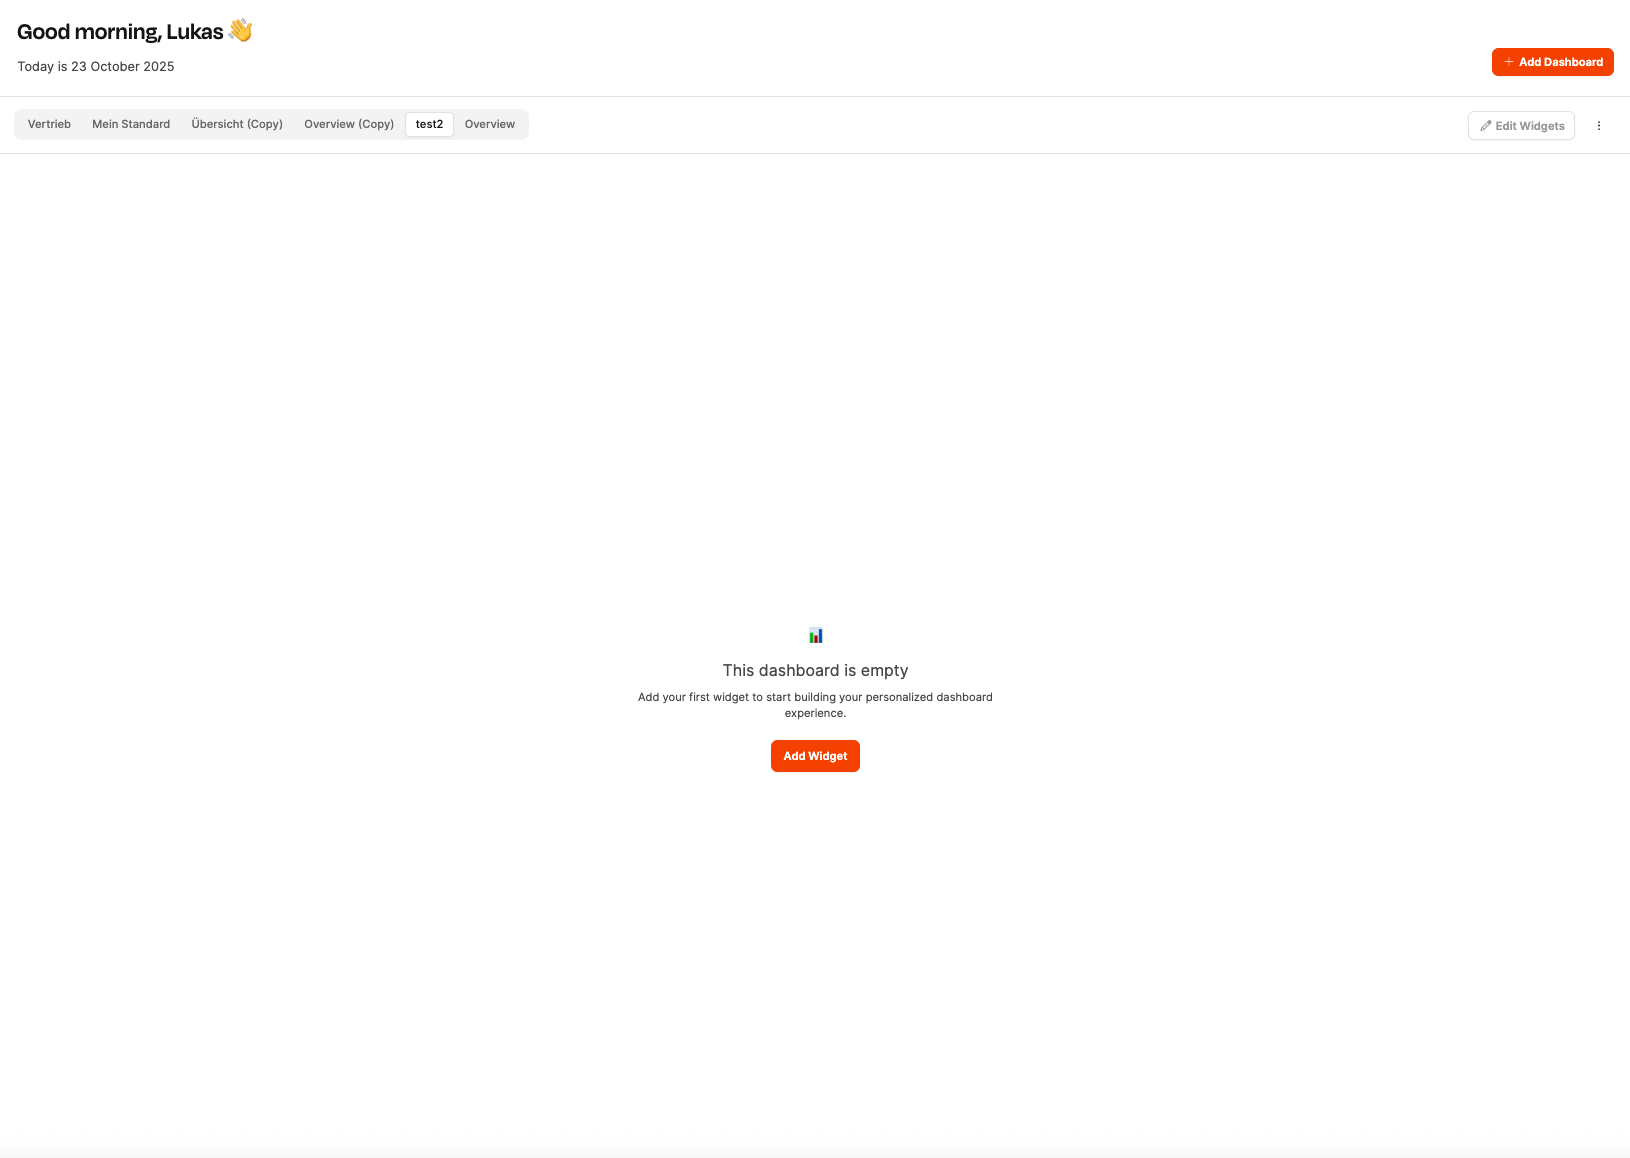
In the dialog window that pops up, enter a name for the new dashboard.
Confirm with “Save”.
The new dashboard will be created empty and you can fill it with widgets afterwards.
Widgets are the building blocks of a dashboard. They can display info (like task lists or charts) or offer tools (like time tracking).
Here's how to add a widget:
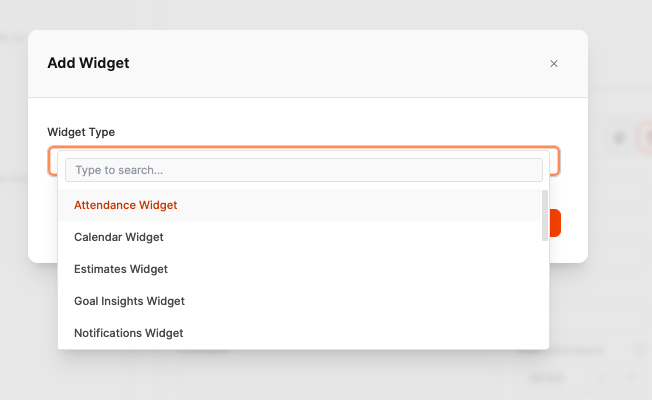
Click on “Add Widget”.
Choose a widget type from the dropdown menu.
Depending on the widget, you can configure extra options (like a data source or a view).
Click “Add” to place the widget.
Dashboards use a flexible six-column layout.
Each widget can be resized in both width and height:
Width: 1 – 6 columns (like one-third, half, or full width)
Height: freely resizable
You can move widgets by drag & drop and resize them.
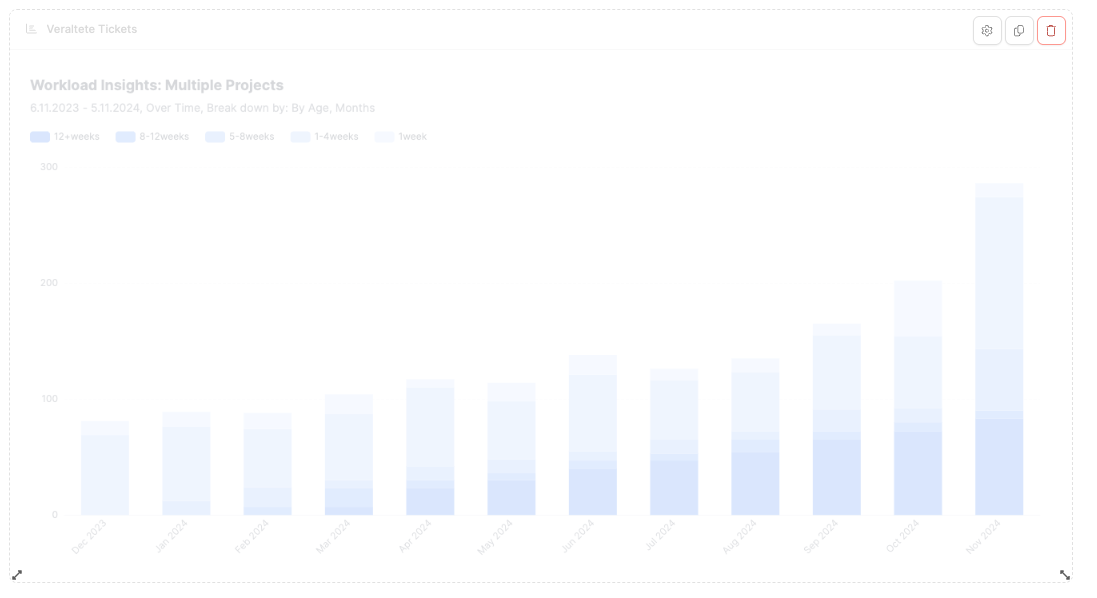
At the bottom of each widget, there are arrows to resize, and at the top, three buttons:
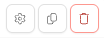
⚙ Configure: Edit widget settings (e.g. change chart preset)
📄 Duplicate: Create a copy of the widget
🗑 Delete: Remove widget
With the “Compact” button you can auto-arrange the view to save space.
Using “Exit Edit Mode” you'll leave edit mode and return to the normal view.
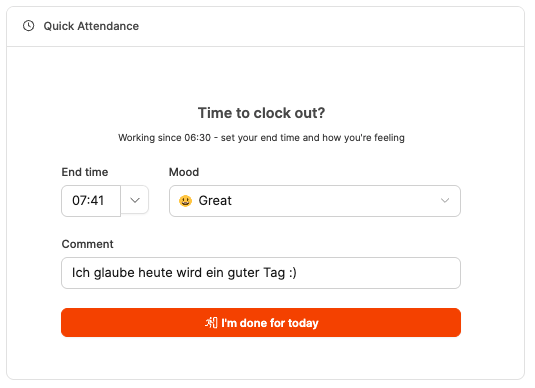
This widget lets you quickly clock in or out straight from your dashboard.
Here you can see your current working hours, pick your mood emoji and leave a quick note – something like “Lots of testing planned today”.
The widget helps you log attendance with barely any effort, no need to switch to the time tracking module.
It’s often used along with the Calendar Widget or Time Tracker Widget.
Read more about attendance tracking (clocking in and out)
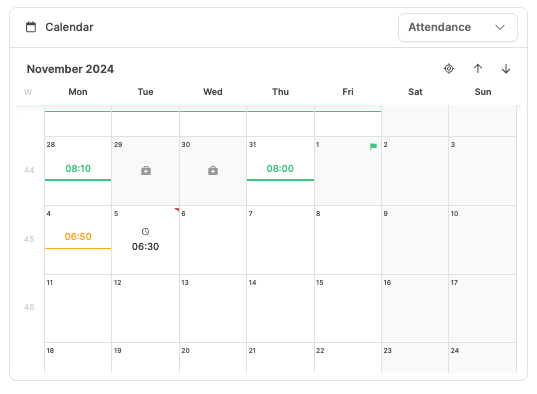
Shows your personal or project calendar.
You can set which calendar mode is shown by default:
Attendance
Mood tracker
Time tracking
Billable time
The widget can show, for example, the working hours of a week, mood entries, or recorded project hours.
Perfect to get an overview of workdays, absences, or planned bookings.
Learn more about the Time-Tracker
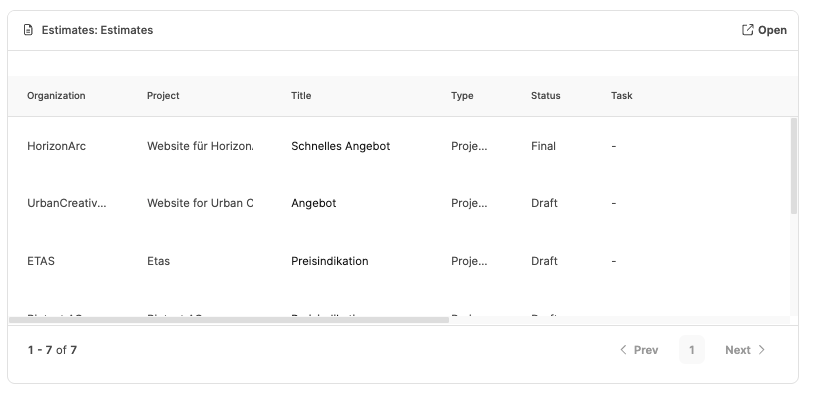
Lets you access estimates right from the dashboard.
Here you can show predefined list or Kanban views – for example:
"Open offers"
"In negotiation"
"Rejected or won"
This widget makes it easier to always keep an eye on sales status, without needing to open the "Offers" area separately.
More about Offers
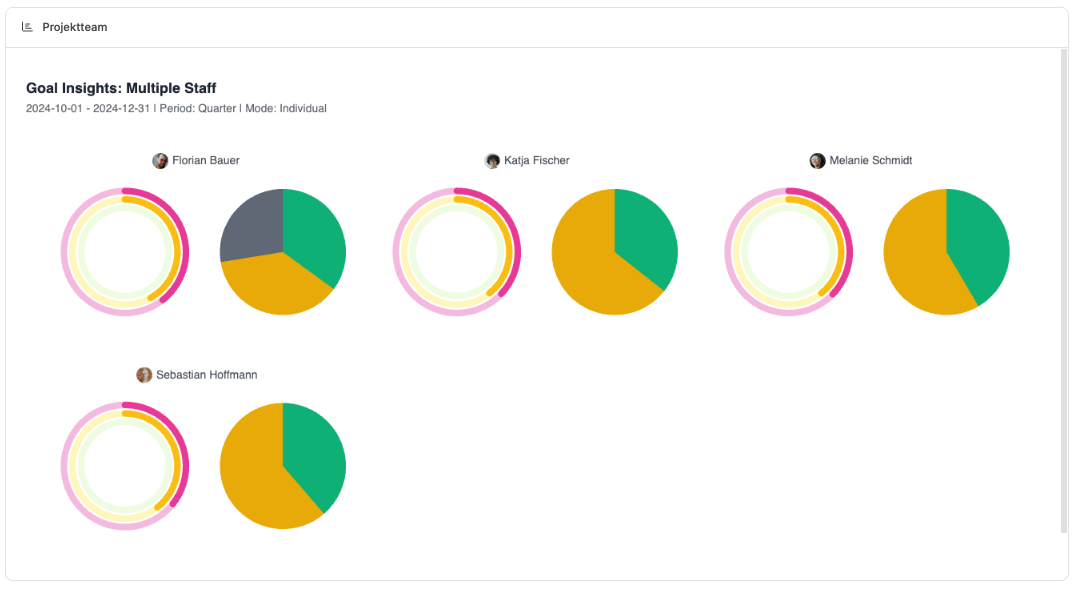
An analytics widget from the Insights area.
It shows predefined chart presets for goal achievement, KPIs, or progress over time.
Examples:
Goal achievement per team or department
Progress of ongoing projects
Ratio of planned to actual hours
Perfect for managers who want to keep an eye on the current status of key metrics every day.
More about Goal Insights
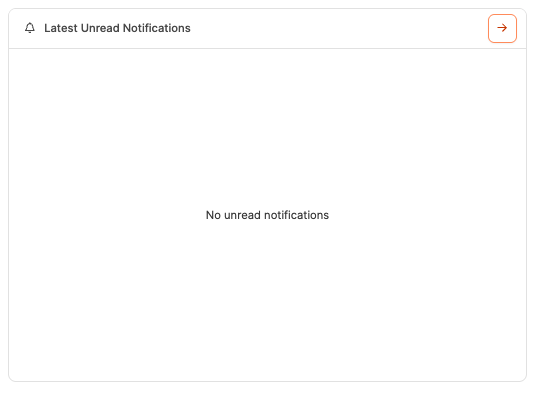
Shows the latest notifications from the system.
In the configuration menu you can set whether all or only unread notifications are shown.
This widget bundles updates from projects, tasks or comments and makes sure you don't miss any important events.
More about the messaging system
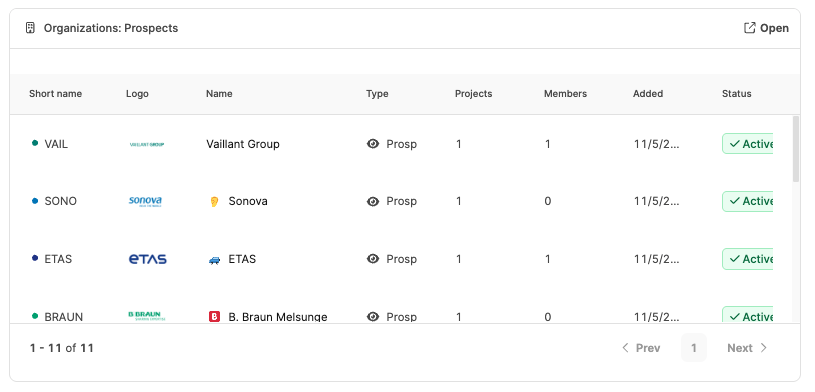
Embeds views from the Organizations area – like customers, suppliers or business partners.
With saved Views you can show targeted data, for example:
“My customers with open projects”
“Active sales opportunities”
“Contract partners by region”
The display follows the selected view type (list or Kanban), so you get a dashboard with a CRM vibe.
More about Organizations
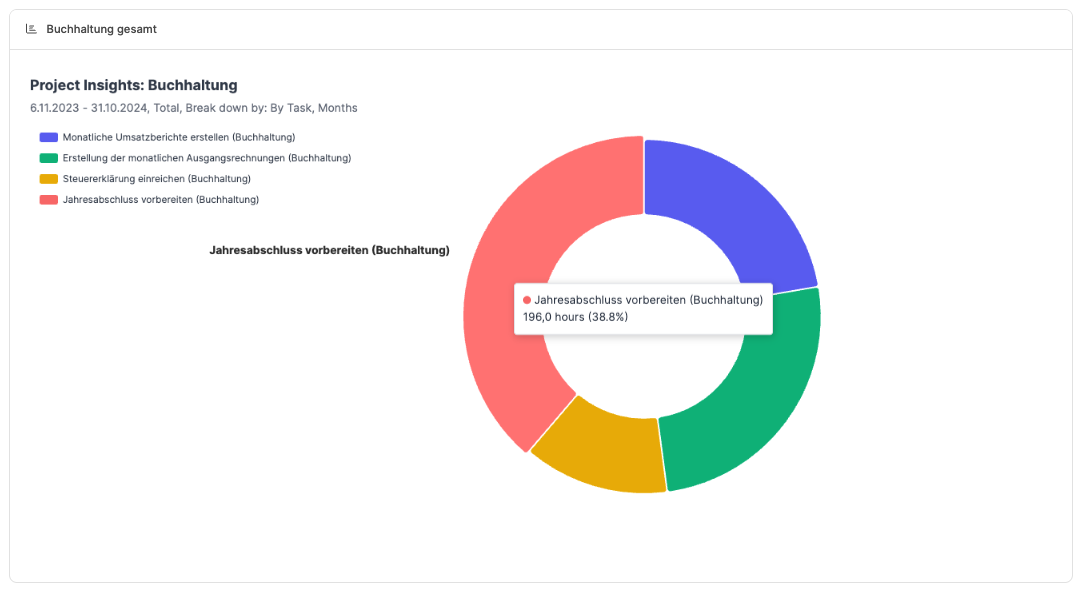
Another chart widget that visualizes data from the project analysis.
You can display, for example:
Project progress
Budget usage
Time variances
Task status across projects
The widget can be linked to saved chart presets so recurring analyses show up automatically.
More about project insights

Shows active or completed projects in a list or Kanban view.
Filter options:
Internal projects
External projects
Sales opportunities
The widget helps you keep track of project status in one place and gives quick access to detail views.
Via projects
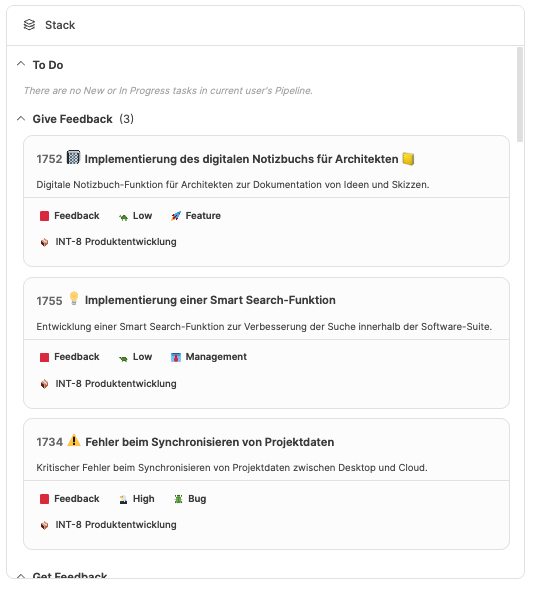
The Stack Widget shows your personal work stacks (Stacks) – kind of like a developer pipeline or task list.
It's especially handy for teams that work by priorities or status in consecutive work stages (e.g. "To Do", "In Progress", "Done").
Developers often use it to visually organize their workflow.
More about Stacks
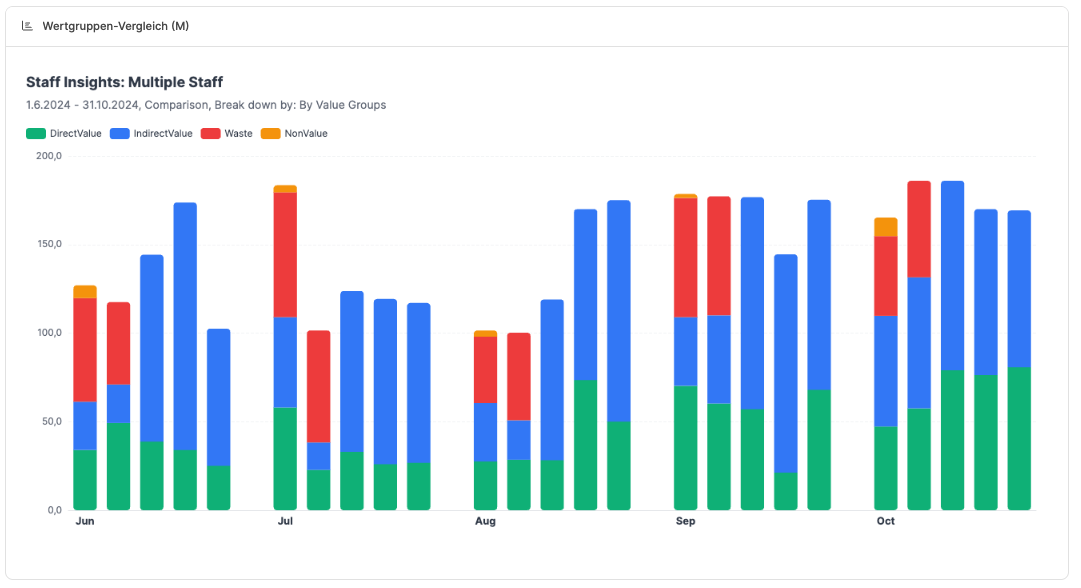
A staff analytics widget.
It shows evaluations for employee and team metrics, for example:
Utilization by team or employee
Average working hours
Distribution of billable hours
Presence and activity stats
This way team leads can instantly see where there's overload or free capacity.
More about Employee Insights
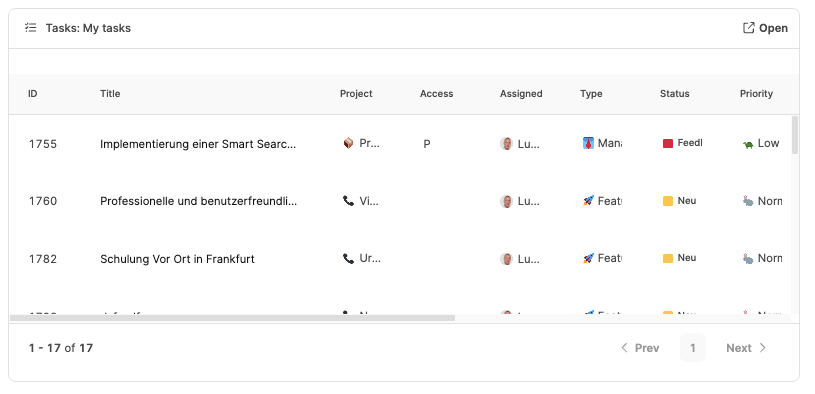
The Tasks Widget shows tasks from the ticket system – either your own or project-specific tasks.
That way, you can keep track of which tasks are currently open, in progress or done right from your dashboard.
It's perfect for personal to-do overviews or as a team task board.
More about Projects – Tasks tab (ticket system)
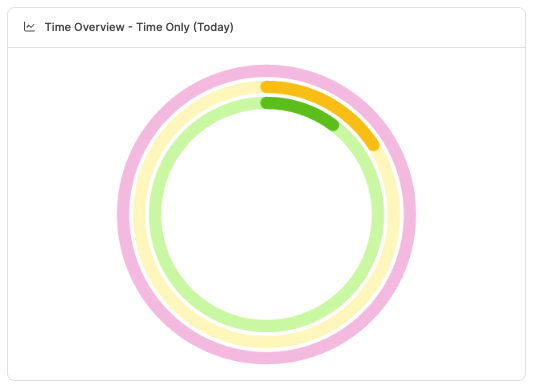
A visual Time Statistics Widget.
It shows logged times over selectable time ranges (day, week, month, quarter) and compares:
Attendance time
Logged time
Billable time
So you can visualize progress and goal achievement — like how much of the planned working time is billable.
About Time Tracking Goals
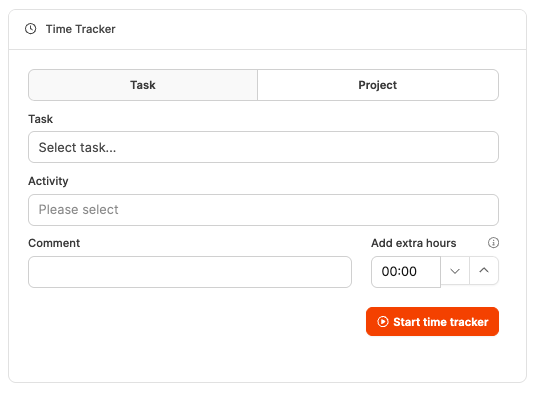
A handy tool to log time right from your dashboard.
Here you pick task, activity and project, add a comment, and start tracking with a single click.
Perfect for folks who work with timesheets daily and need to quickly switch between tasks.
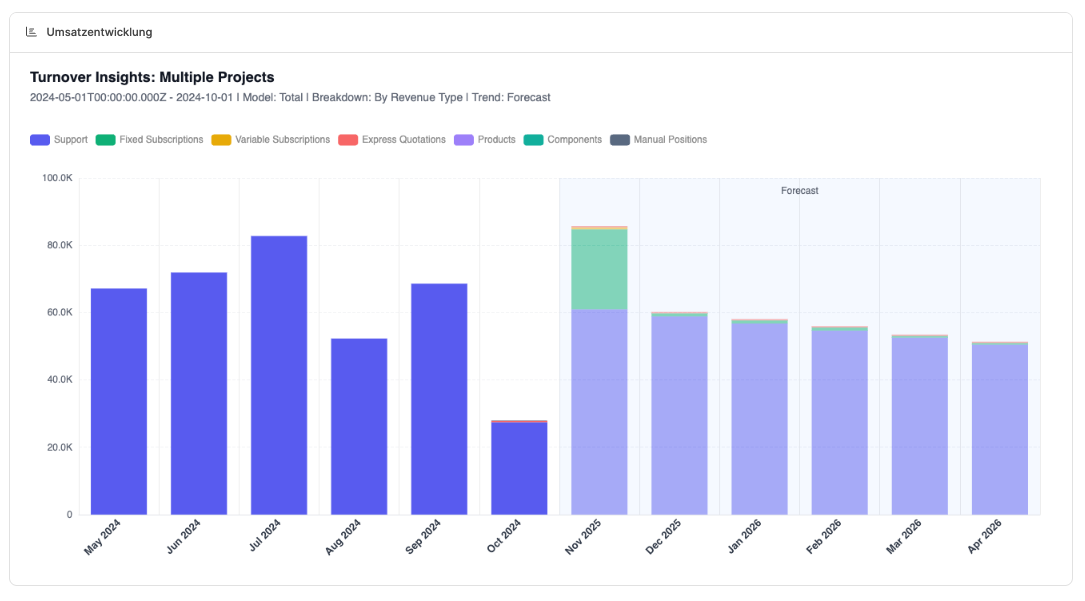
Shows turnover statistics visually.
Examples:
Revenue per customer
Monthly revenue trend
Planned vs. actual revenues
The widget supports chart presets and is especially useful for management and controlling.
More about Revenue Insights
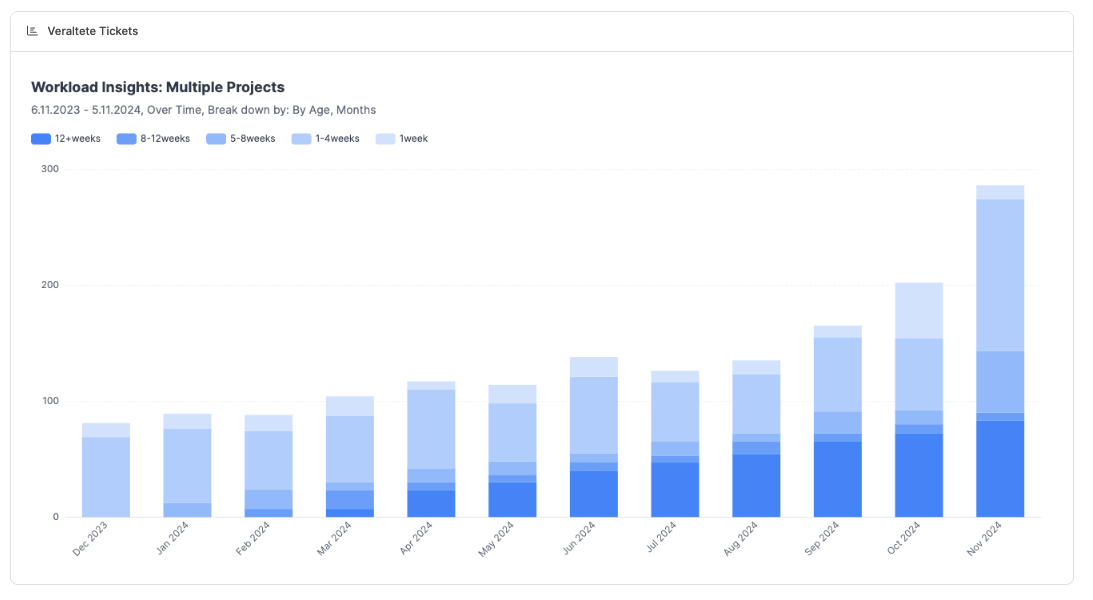
Visualizes the workload of teams and projects.
Here you can see at a glance how evenly the workload is distributed, which projects are overbooked, or where capacity is available.
The widget is based on real-time data from tasks and time entries and is a key tool for resource planning.
More about Workload Insights