The Project Insights section in Leadtime lets you dive into a detailed analysis of work hours and activities in projects. It helps you track trends over time, spot bottlenecks, and make informed decisions about resources and priorities. Here, companies can see how many hours are spent on projects, tasks, or users—across days, weeks, or months.
Via Projects

With Project Insights, you can get solid answers to both operational and strategic questions—like:
How is the team's effort spread over time?
Which types of projects tie up the most resources?
Where do hours spent significantly go up or down?
Which team members work the most in specific phases?
These insights help you proactively manage projects and resources.
The page is split into two sections:
Left column: Configure how you want to analyze (filters, time range, display)
Right column: See results shown in various chart types
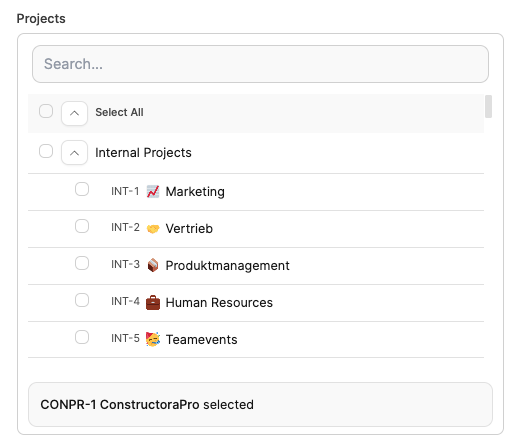
Pick one or several projects
Mix internal and external projects
Optional: Search field for quick filtering

Start date: sets the start of the analysis
End date: defines the end (open = current date)
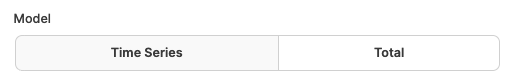
Time series: shows the progression over time (weeks or months) – ideal for trend analysis
Total: aggregated view of all hours – ideal for distribution analysis
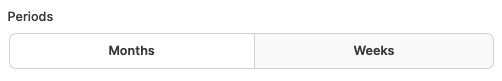
Weeks: fine-grained for sprint or short-term evaluations
Months: clear overview of longer developments
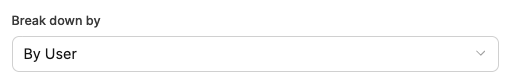
Project: shows the comparison of multiple projects
Task: shows effort per task
Task type: groups e.g. by feature, bug, idea or management
User: compares individual time shares in the team
None: shows the overall course without splitting

Groups: shows separate bars for each unit (e.g. project or user)
Stack: shows stacked bars with color coding
After selecting the parameters, the “Create chart” button creates the corresponding visualization.
Bar chart: Standard view for time series
Stacked bars: shows totals with internal breakdown
Pie chart: Overall distribution by projects or categories
Trend line: cumulative progress over the period
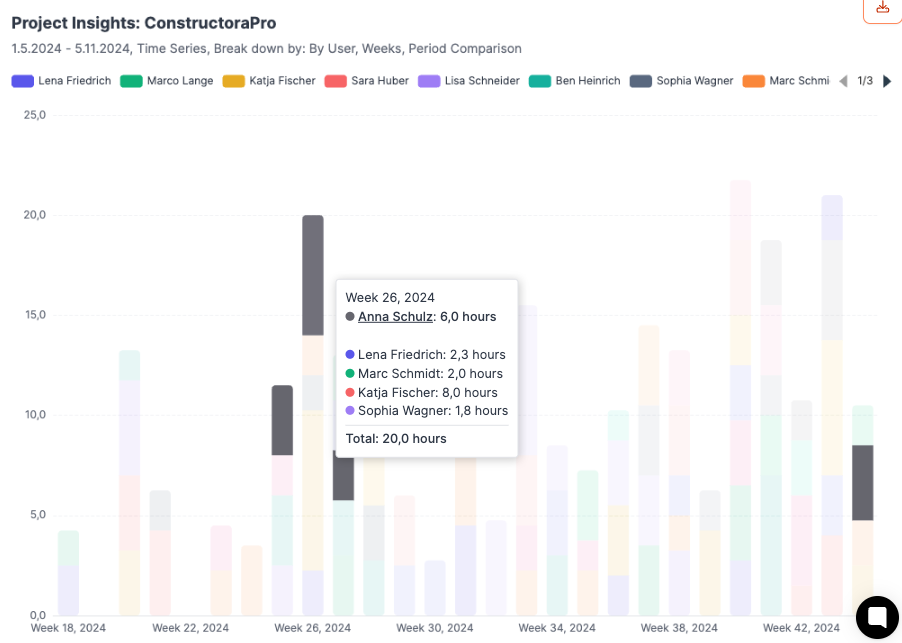
When you hover over a bar with your mouse, details like hours, users and categories will show up.
Excel export: download data as a table
Save presets: keep common reports
Update presets: adjust existing reports
The saved diagrams can be viewed on the Dashboard.
Question | Configuration options |
How are 500 hours distributed across Project XY over the past weeks? | - Select project - Set start date - Model: Time series - Period: Weeks or months - Breakdown: None / Task type / Tasks / User |
How are 5000 hours from internal projects spread across individual teams? | - Select projects - Set start date - Model: Total - Breakdown: None / Task type / Tasks / User |
How many hours were booked each month on Project X, Y and Z? | - Select projects - Set start date - Model: Time series - Period: Weeks or months - Breakdown: None / Task type / Tasks / User - Show data: By group |
How many hours were spent in total on Project X, Y and Z? | - Select projects - Set start date - Model: Time series - Period: Weeks or months - Breakdown: None / Task type / Tasks / User - Show data: By stack |