With Workload Insights you can analyze how the number of open tickets are changing in your projects – either right now or over longer periods. The goal is to make workloads transparent, spot trends early, and avoid overloads. This view is especially helpful for support and project teams to identify bottlenecks and manage the processing of open tasks more efficiently.
With Workload Insights you can instantly see if your team is keeping up with the current workload. You'll spot which projects are particularly busy and where tasks are piling up. The analysis helps you manage resources, adjust priorities, and make sure the team’s workload is well balanced.
The page is split into two sections:
Left column: Configure your analysis (projects, time periods, breakdowns)
Right column: Visualize the results in charts
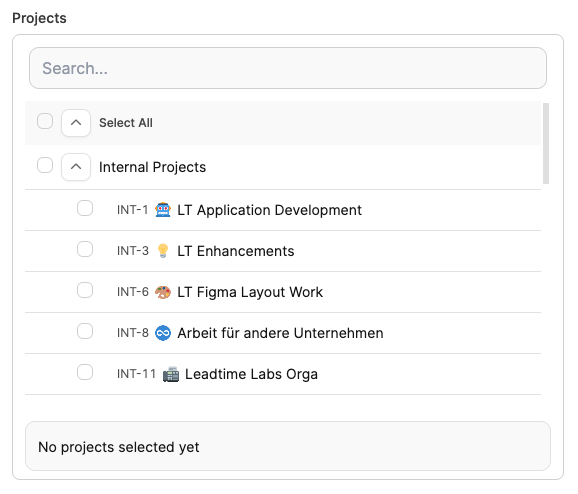
Select one or more projects (internal or external).
Optionally, you can filter for specific project names using the search field.
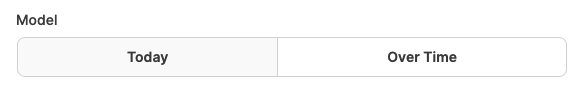
Today: Shows the current status of open tickets in the selected projects.
Over time: Shows how the number of open tickets changes over weeks or months.
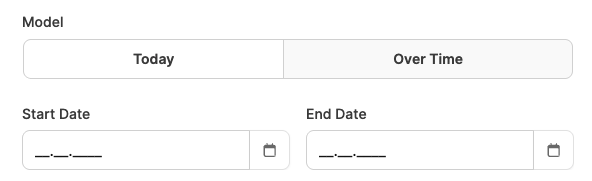
Active with model Over Time.
Freely selectable start and end date.
Optional display by weeks or months.
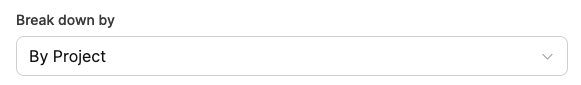
Decide how you want the data to be grouped:
Project: Comparison of ticket stock between projects.
Status: Displayed by processing phases (e.g. New, In Progress, Feedback).
Task type: Differentiate between Feature, Bug, Idea, Management, etc.
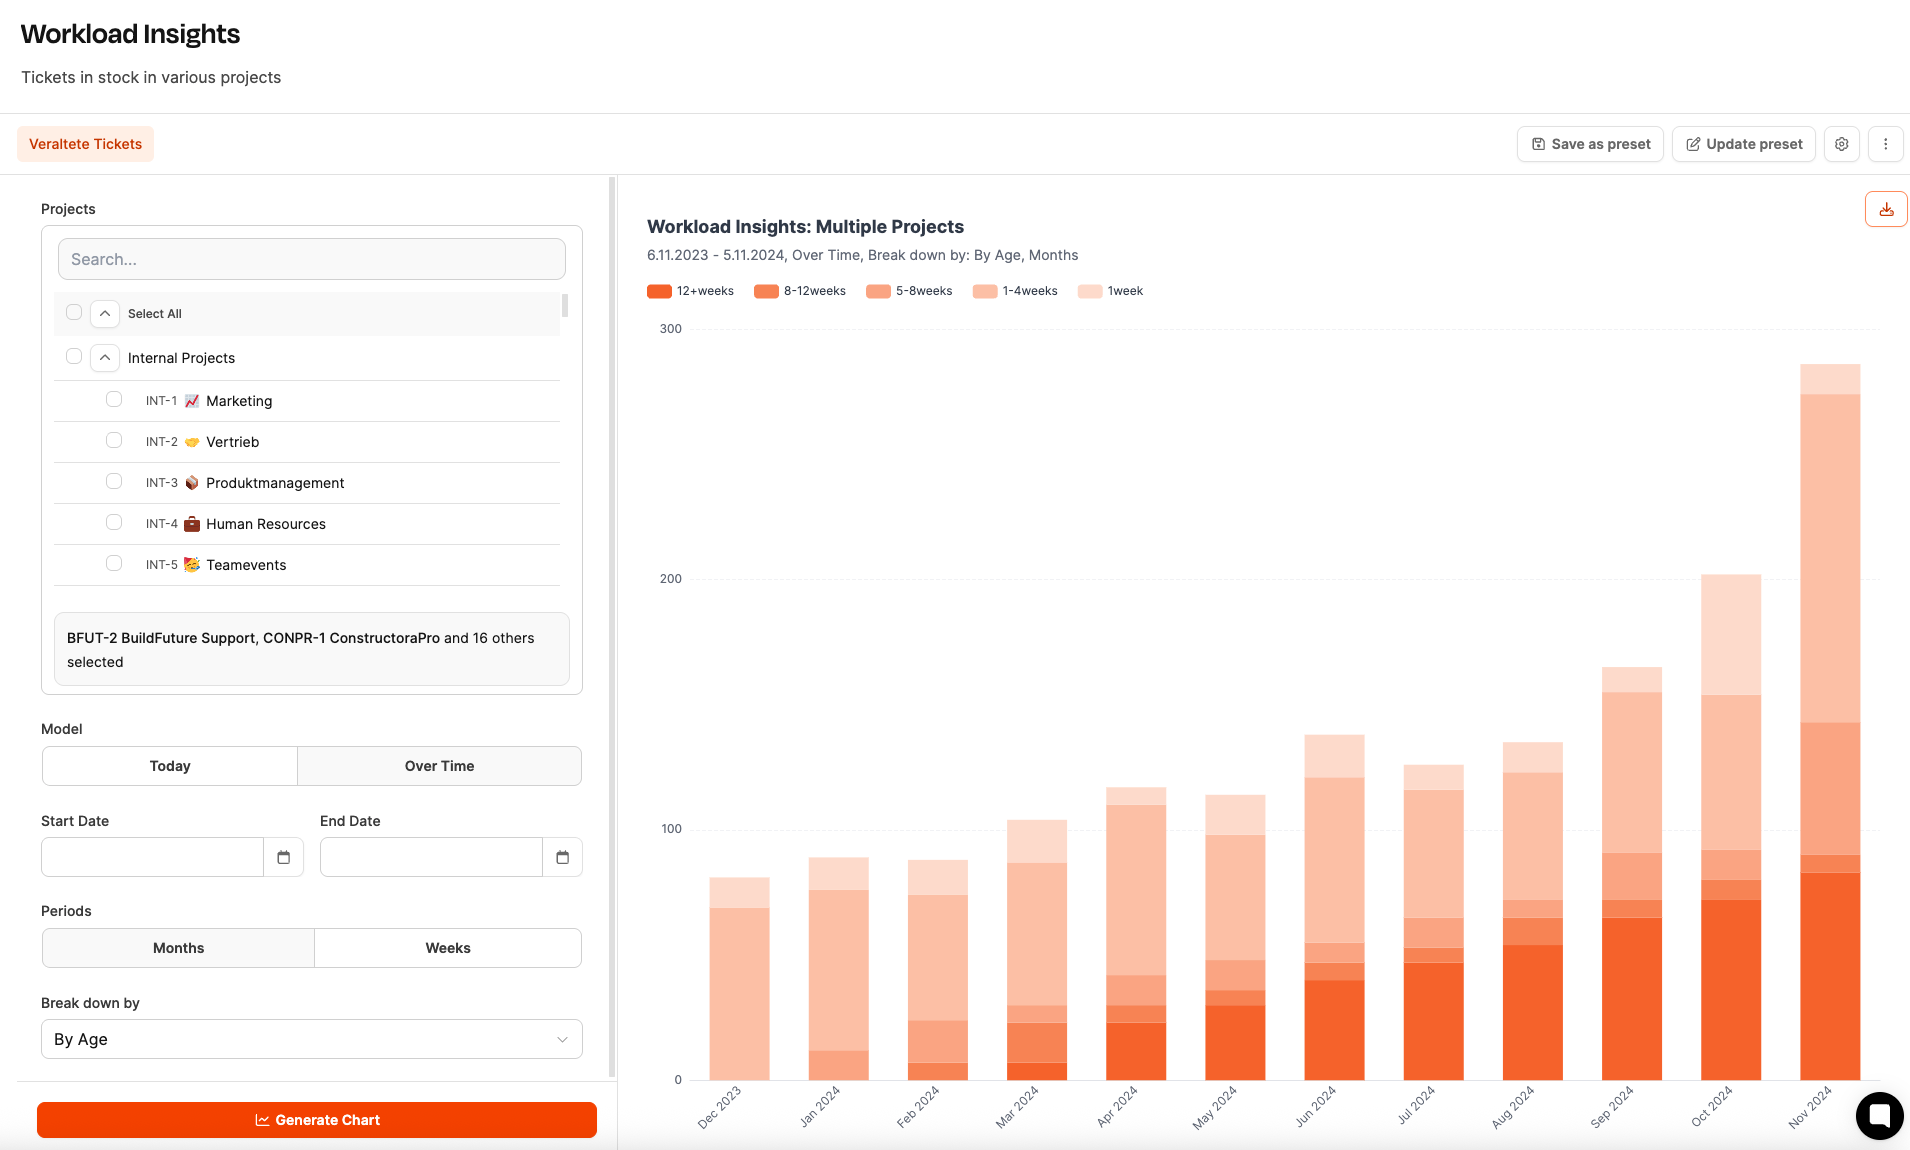
Age: Grouped by ticket lifetime (e.g. "under 1 week", "4–8 weeks", "over 12 weeks").
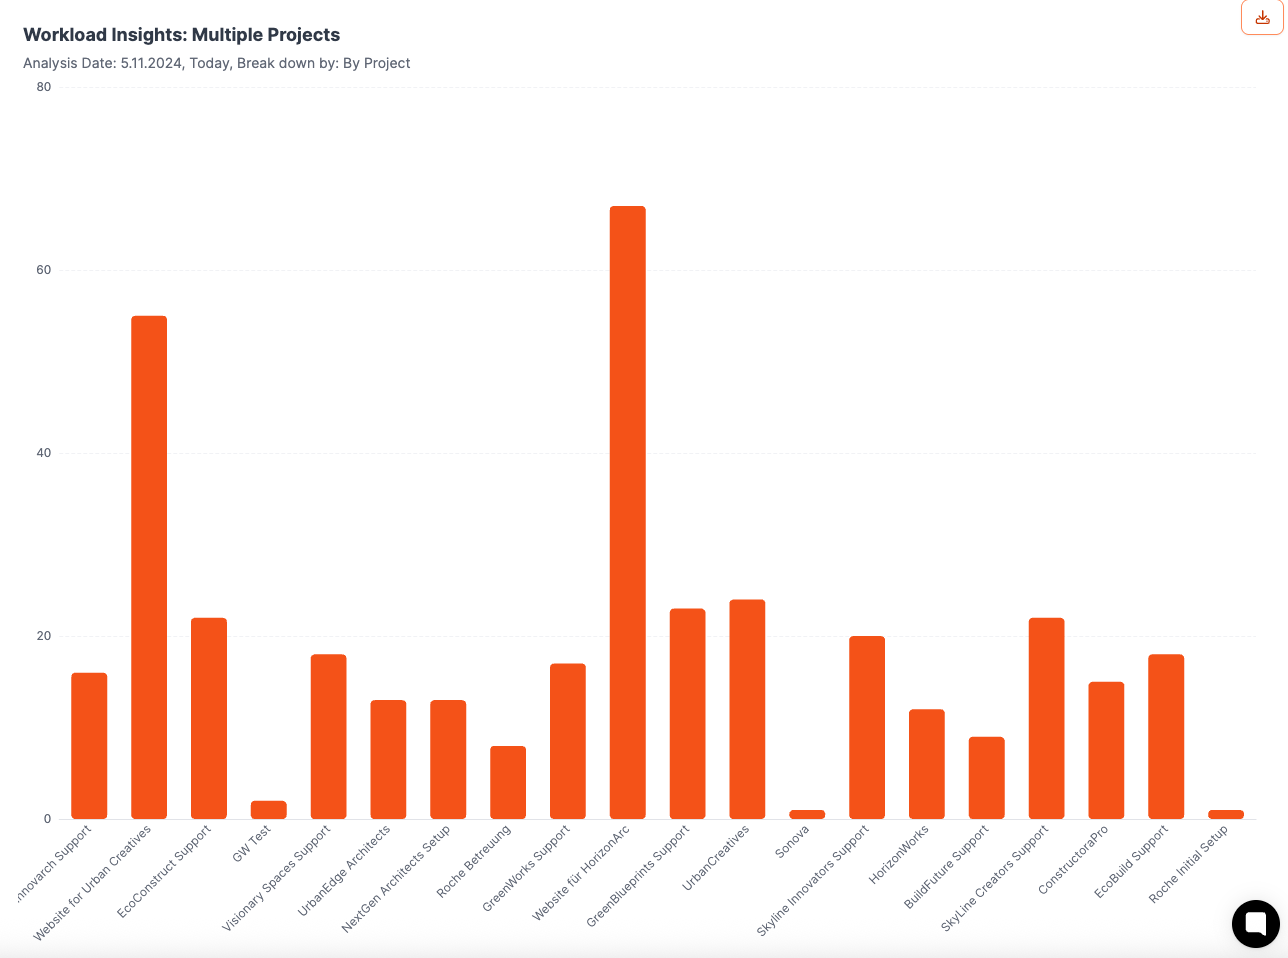
Shows the current ticket stock as a bar chart, grouped by:
Project
Status
Task type
View is great for seeing at a glance where the most work is currently happening.
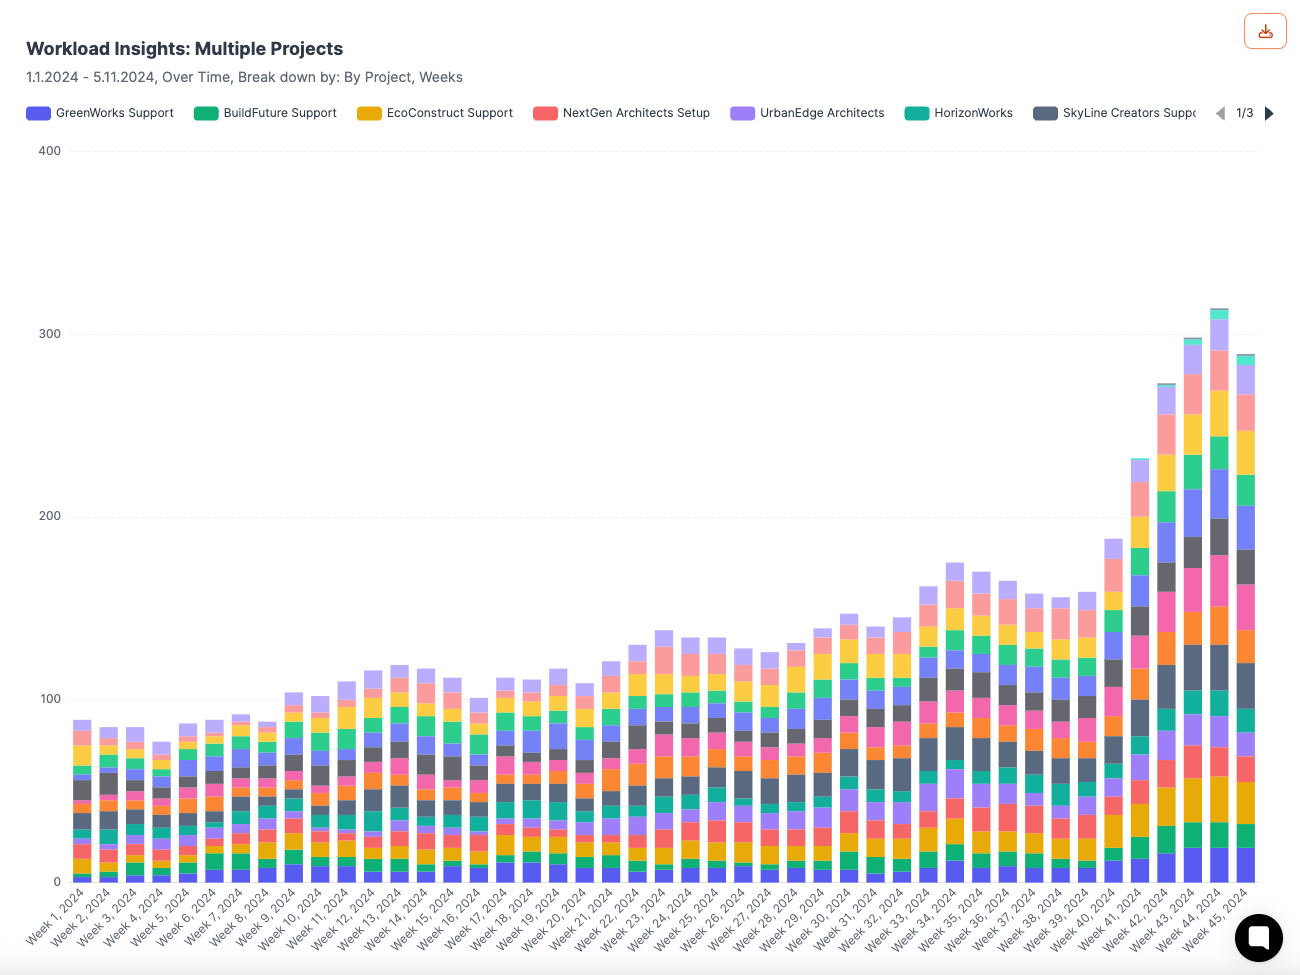
Shows the progress of open tickets over weeks or months as a stacked bar chart.
Visualizes trends: increase, decrease, or stagnation in tasks.
Shows bottlenecks or outdated tickets.
Categories: status, task type, or age.
Question | Settings options |
How many tickets are currently open and in which projects? | - Select projects- Model: Today- Breakdown by project |
How has the workload changed over the last few months? | - Select projects- Model: Over time- Set start date- Time periods: weeks or months- Breakdown by task type |
How many tasks are overdue and is that number growing? | - Select projects- Model: Over time- Set start date- Time periods: weeks or months- Breakdown by age |
The saved diagrams can be displayed on the Dashboard.